Big Data Exploration e Data Visualization: SAS Visual Analytics
E' con grande entusiasmo e partecipazione degli studenti che si svolge oggi la lezione della Prof.ssa Barone Alessandra.
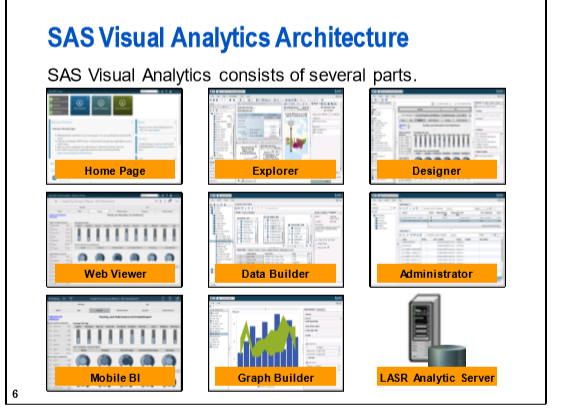
E' stato illustrato come creare e visualizzare report con SAS VIsual Analytics:
Explorer Data,Visualize data interactively
Designer Reports, Create interactive reports
Web Viewer, View reports in a browser
Data Builder, Build new data sources
Graph Builder, Create custom report objects
LASR Analytic Server,In-memory server
#Reporting, #VIsualAnalytics, #SAS,#mastercesma